Varnish-Related Difficulties in Turbine and High Pressure Hydraulic Systems.
| In recent years industry has seen an increase in varnish-related difficulties in Turbine and High Pressure Hydraulic Systems. This increase is attributed to higher machine operating temperatures, smaller fluid reservoirs, cyclic service, and the use of higher saturate base oils that have lower solvency for varnish precursors. The development of finer filtration providing clean dry lubricant increases the opportunity of high energy electrostatic discharge spark occurring, which heat cracks the hydraulic or turbine fluid significantly increasing varnish deposition. |
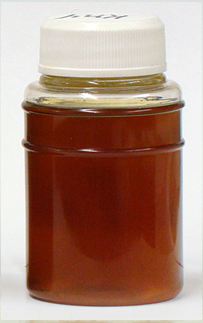
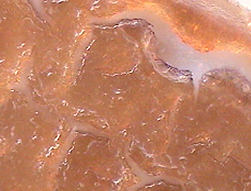
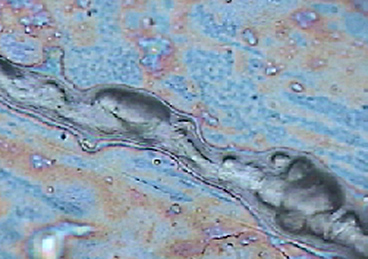
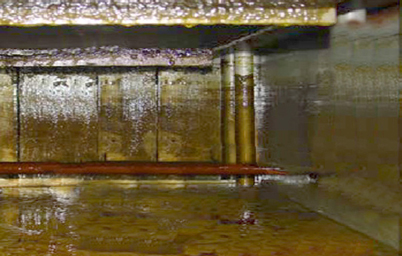 Example Image of Varnish Deposited in a Turbine Lube System Reservoir. |
Difficulties in testing for Varnish
Testing for varnish in the lubricant proves difficult because usually varnish is a plated out polymerised coating adhering to hot surfaces. Varnish is formed when a damaged sludged portion of the lubricant is subjected to heat and pressure which polymerises the sludge into a varnish like coating that is difficult to remove and can prevent oil films from correctly forming compromising reliability. In systems where the lubricant is being damaged the gelled sludge portion of the lubricant will reform on cooler surfaces in system. Excessive varnish leads to filter plugging and the malfunction of moving parts
But if the lubricant damage is diagnosed early enough the heat gelled sludged portion of the fluid can be resolubilised back into the turbine fluid once appropriate filtration has been applied to remove the damaged portion from the lubricant.
Because the majority of the varnish precursors are a submicron fragile gel that has proven difficult to trend, analyse and predict, many of the traditional tests used to monitor turbine oils have difficulty in accurately predicting the oncoming deposition of varnish.
Once a saturation point is attained for the fluid a significant deposition of gelled lubricant is already occurring throughout the lubrication system with the potential for the gelled portion coming into contact with hot high pressure areas polymerising the gelled portion of the lubricant into a hard and difficult to remove varnish like coating.
Quantitative Spectrophotometric Analysis combined Membrane Patch Colourmetry are analysis methods often used to determine the potential of a used lubricant producing harmful internal sludge and varnish build-up. The difficulty with the results of these tests is these analysis can not quantify the amount of gelled lubricant present and only can state “It may form sludge” without certainty because of the difficulty in chemically detecting the organic nature of the gelled sludged fluids deposits. Because of the large volumes of fluid required for the turbine applications any conclusion from the laboratory on filtering or replacing the fluid with new fluid involves significant amounts of money. Using the current ASTM test information to “order” an oil change” does not have enough certainty for R&T to justify to the customer the amount of money required to complete the service.
In addition during investigation on the accuracy of colormetric analysis results R&T has found the deposition upon the Membrane Patch in the majority of circumstances consisted of more than just insoluble gelled lubricant requiring additional maintenance steps leading to the developement of R&T proprietary varnish detection analysis.
R&T’s recent trials on the new ASTM D7843 Membrane Patch Colourmetry also showed when a very high vacuum was used, portions of the sample was removed from the analysis by pulling fractions of the sample through the analysis membrane providing inconsistent results.
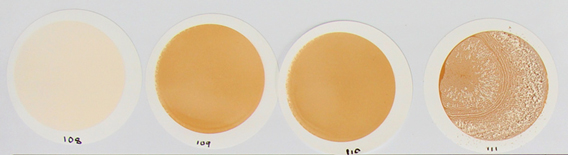
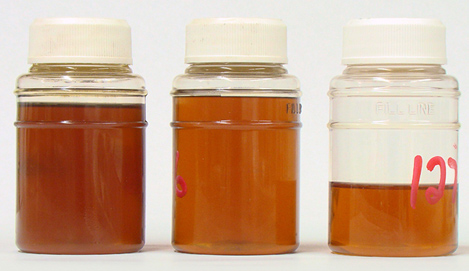
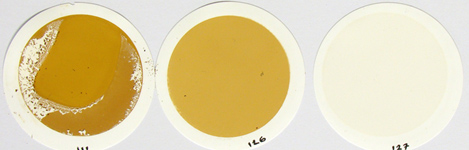
ASTM D7843 Membrane Patch Colourmetric Patches.
Samples used to create the above ASTM D7843 Membrane Colourmetry Patches.
R&T’s Membrane Patch Varnish Analysis
Because of the significant cost involved with cleaning or replacing turbine fluids the current inconsistencies evident in existing colormetric testing prompted R&T to develop a Varnish Precursor Analysis System.
R&T’s experience with Industrial Microscopes combined with visual analysis systems allowed R&T to develop a Varnish Precursor Analysis System that identifies to contaminates extracted from the fluid sample and measures the thickness of varnish deposition. This proprietary analysis system can remove light depositions of gelled lubricant from new turbine fluid samples and as the fluid ages in use, the increase in deposition is easily trended until 3-4 µm of varnish is detected on the analysis filters which is a trigger point for applying filtration to remove the damaged portion of the fluid. This new analysis system for turbine and hydraulic fluids has been designed to measure, weigh and most importantly root cause the reason for the lubricant damage being caused to the fluid.
Once the reason for the lubricant damage is known, the contamination point can be removed and appropriate filtration applied to remove the damaged portion then the system can be simply monitored for any further change.
Another advantage to the R&T proprietary system is we can adjust the sensitivity of the analysis for highly critical systems.
 |
 |
 |
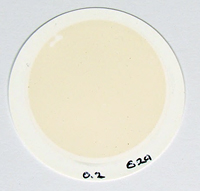
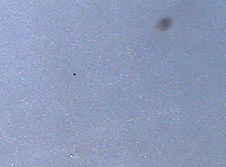
| The Left Hand Image indicates a new oil sample, the membrane patch is shown the centre and the thickness of deposition (0.25 µm) shown in the Right Hand Image. |
 |
 |
 |
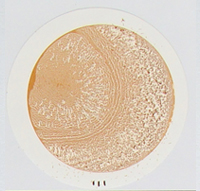
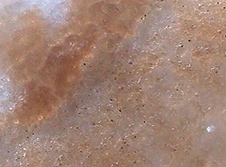
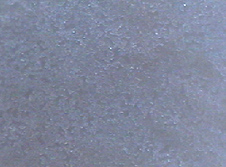
| This Left Hand Image displays a used oil sample, the membrane patch displaying the varnish deposition centre and note the abnormal thickness of deposition (4 – 5 µm) shown in the Right Hand Image. |
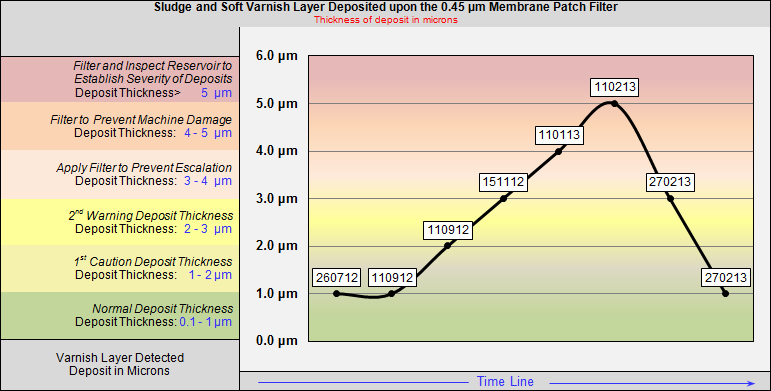
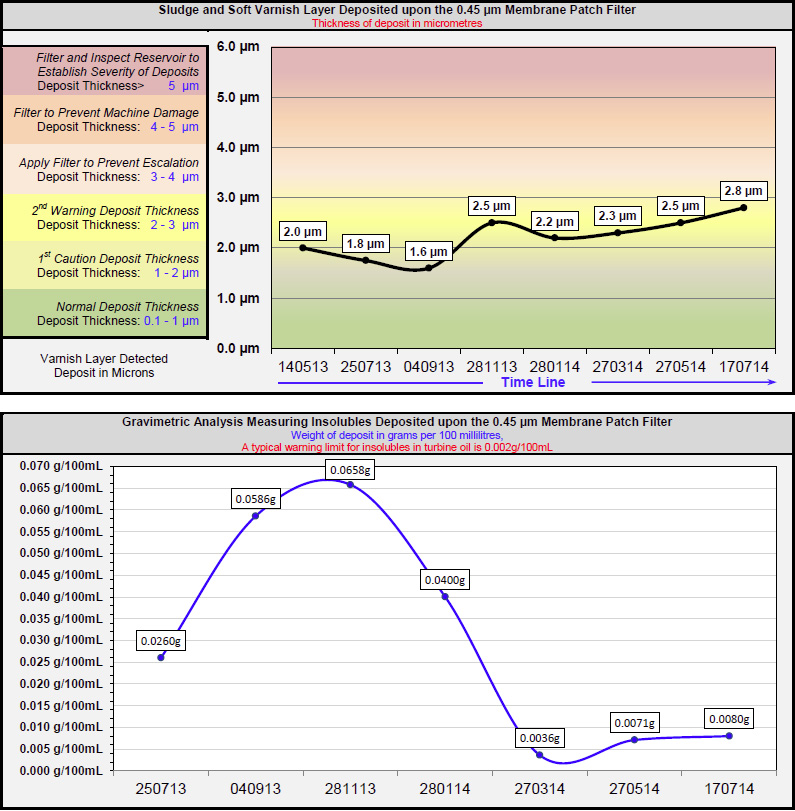
Once the varnish removal system has been applied the reduction in deposited varnish is again visually graphed and when the system returns to normal a MVP value a 3 month trend based analysis will effectively monitor the system for any changes.
This chart indicates the cleaning process after the Sludge and Soft Varnish layer was detected in the hydraulic system. An electrostatic Filter was applied on the 11th Feb 2013 and the varnish layer reduced over the next 3 weeks.
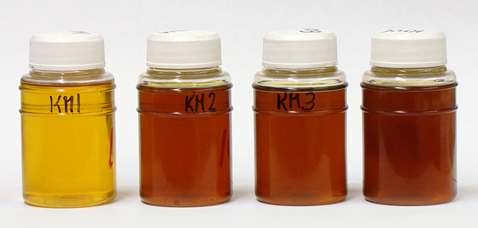
These three samples are from the same system with the samples taken over a 3 week period after varnish removal technology was applied the reservoir.
Note the colour changes to the membrane patches from Right to Left over the 3 weeks after the varnish removal technology was applied the reservoir.
 Before Filtering |
 1 Week Filtering |
 3 Weeks Filtering |
Once the varnish removal system has been applied the reduction in deposited varnish is again visually graphed and when the system returns to normal a MVP value a 3 month trend based analysis will effectively monitor the system for any changes.
This chart indicates the cleaning process after the Sludge and Soft Varnish layer was detected in the hydraulic system. An electrostatic Filter was applied on the 11th Feb 2013 and the varnish layer reduced over the next 3 weeks.
This next chart indicates what occurred after the varnish was removed the increased solvency of the hydraulic fluid proceeded to dissolve the deposited varnish from system.
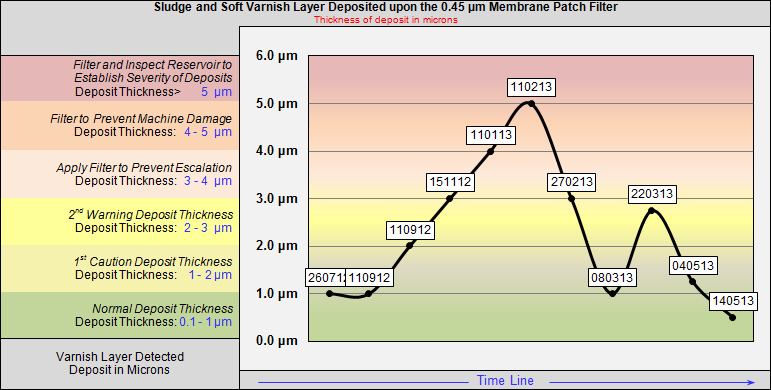
Note the increase in varnish again from the 8th of March to the 22nd of March and the subsequent decrease again to a lower level on the 14th of May after the electrostatic filter was reapplied.
Note the different deposition layer the resolubilised varnish from the hydraulic system creates on the R&T analysis filter.
 |
 |
 |
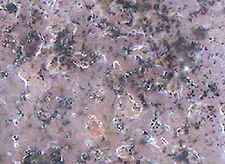
Gravimetric Analysis
Currently Gravimetric Analysis is completed on all Membrane Patch Varnish Potential samples and because Gravimetric Analysis is easily influenced from deposited metallic wear debris the results are only relevant if a Wear Debris Analysis is also completed to establish the ISO Particle Count and the amount of metallic wear debris in the sample.
The types of metallic wear debris usually encountered are steel and bronze who both have Specific Gravity in the 7-9 range but the Specific Gravity of the gelled lubricant deposited is less than 1 consequently it does not take a large amount of deposited metallic wear debris to artificially elevate the gravimetric results supplying information that metallic wear debris has also been deposited upon the analysis filter.
Below is an example combination Gravimetric Insolubles Gelled Lubricant deposit thickness Chart.
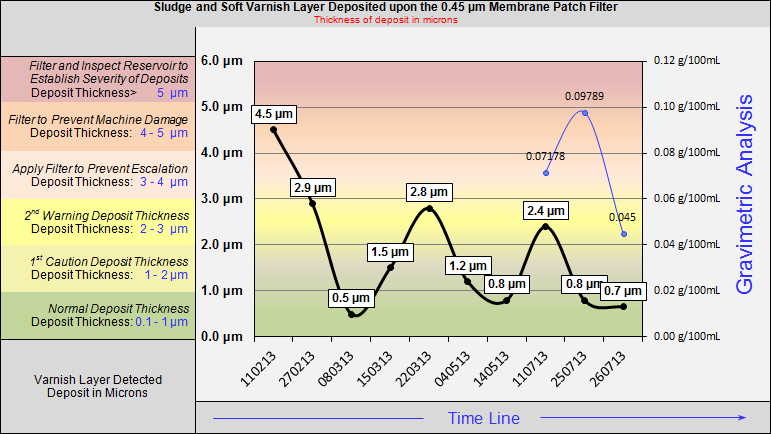
Gravimetric commenced 11/07/13, the peaks in the gelled lubricant deposits are due to electrostatic filtering and the cleaned fluid re-solubilising deposited gelled sludged portion of the lubricant from out of the lubrication system.
We have since separated these charts because the relevance of gravimetric measuring Varnish deposition is easily affected by heavier particles and debris also deposited upon the Membrane patch.
Stray Current Discharge
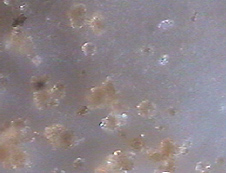
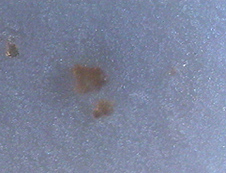
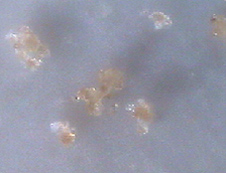
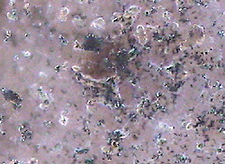
R&T’s proprietary Membrane Varnish Potential (MVP) analysis system also detects abnormal wear with these following images showing the results when stray current discharge occurs in the lubrication system.
 |
 |
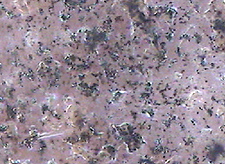 |
| These three images above @ 1000X show the carbonised lubricant particles that R&T’s MVP system has separated out onto the analysis filter. Once the information in these images is known then addition analysis will show where and how the electrostatic discharge and in this instance the arcing is occurring in the oil filter and the high temperature created by the high intensity stray current arc discharge is the primary cause of the varnishing damage to the hydraulic fluid. |
 |
To allow new customers to evaluate R&T’s Varnish Precursor Analysis System R&T will be interested in completing a couple of no charge Membrane Varnish Potential Analysis.